4. Results
There are more than 1,000 sake breweries in Japan, and in this project, water was provided from 283 locations and water quality analysis was performed (Fig. 7).
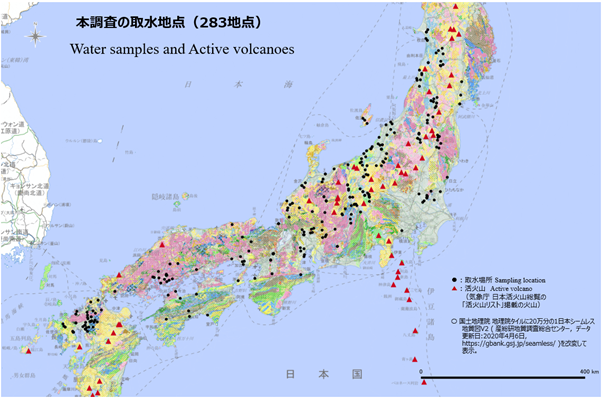
Fig.7 Water samples and Active volcanoes
For 283 samples, the content of the main dissolved components (4 components of anion: Cl–, HCO3–, SO42-, NO3– and 4 components of cations: Mg2+, Ca2+, Na+, K+ ) was measured and diagramed.
The diagram called “Hexa-Diagram” and “Trilinear-Diagram” are used to represent the results of water analysis. These diagrams are usually unfamiliar to non-specialist, so we will first explain the view and meaning of the diagram (Fig. 8).
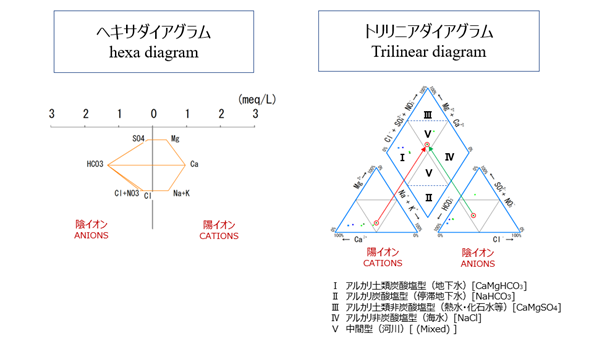
Fig.8 Hexa diagram and Trilinear diagram
When clarifying groundwater flow, factors of water quality formation, water quality formation evolution, etc., the concentration (mg/L) of each dissolved component is expressed by “Hexa diagram”. Across the vertical axis of the diagram, the horizontal axis is illustrated with the respective net concentrations of cations and anions at the length from the axis. In this diagram, its shape (hexagonal shape connecting the coordinates of each ion) indicates the composition of dissolved ions in water, and the size of the shape (distance from the axis) represents the dissolved ion concentration.
“Trilinear diagram” represents the content ratio of cations and anions in a ternary diagram, and plots the two ternary diagrams on a composite diamond-shaped diagram (called “key diagram”) to illustrate the characteristics of the measured water. At the plotted location in this key diagram, you can guess what origin the water originated (placed in the environment).
These hexa diagram and trilinear diagram can be used together to presume the environment and source of the water.
The Japanese Islands can be roughly divided into three geological zones: “Northeast Japan”, “Inner Zone of South West Japan”, and “Outer Zone of South West Japan”, and each has different geological features (types of widely distributed rocks).
When we examined whether there was a difference in water quality depending on the geological zone for the measurement of 283 points, it was clarified that there was a difference in the distribution of SE Japan and SW Japan inner zone. (Unfortunately, SW Japan outer zone has too small number of samples, so we could not find any features).
| Geological Zone | NE Japan | SW Japan (Inner Zone) | SW Japan (Outer Zone) |
| Sample Num. | n = 130 | n = 147 | n = 6 |
| Ⅰ アルカリ土類炭酸塩型 | 65 (50.0%) | 94 (63.9%) | 4 (66.7%) |
| Ⅱアルカリ炭酸塩型 | 2 (1.5 %) | 3 (2.0%) | – |
| Ⅲアルカリ土類非炭酸塩形 | 3 (2.3%) | 2 (1.3%) | – |
| Ⅳアルカリ非炭酸塩型 | 13 (10.0%) | 13 (8.8%) | – |
| Ⅴ中間型 | 47 (36.2%) | 35 (23.8%) | 2 (33.3%) |
If you examine it in detail like this, you can characterize water as follows depending on the type of geology.
- Source rock dependence type: Rock factors are reflected in water quality.
– Jurassic accretionary prism, high P/T metamorphic rock, granite and granodiorite, volcanic rock, Pleistocene limestone, pyroclastic flow deposits, marine deposit, etc.
- Groundwater flow type: Mixing of multiple sources of water due to the underground residence environment are stronger than the effects of rocks, and the water quality is strongly affected.
– River terrace deposits, coastal plain sediments, river sediments, mountain basin sediments, etc.
When considering according to this classification, it can be said that there are a lot of flowing underground water types in NE Japan, and there are a lot of source rock dependence types of granite and granodiorite in the SW Japan inner zone.